
Objective
The Water Behind What We Eat is an educational infographic designed to inform viewers about the hidden water consumption behind common foods and its impact on sustainability. The goal of the infographic was to take a dense amount of information and present it in a way that feels approachable and easy to understand for audiences who may be unfamiliar with the topic, while still encouraging them to learn more and form their own opinions.
Research
The first step in creating the infographic was researching my chosen topic, hidden water footprints, to better understand the information and its broader impact. After gathering information from multiple sources, I organized the content into smaller informational sections to make it easier to structure and translate visually within the infographic. The primary articles used throughout the research process were The Water Footprint of Food and Water footprint of food: what is it and what can you do?


Sketches
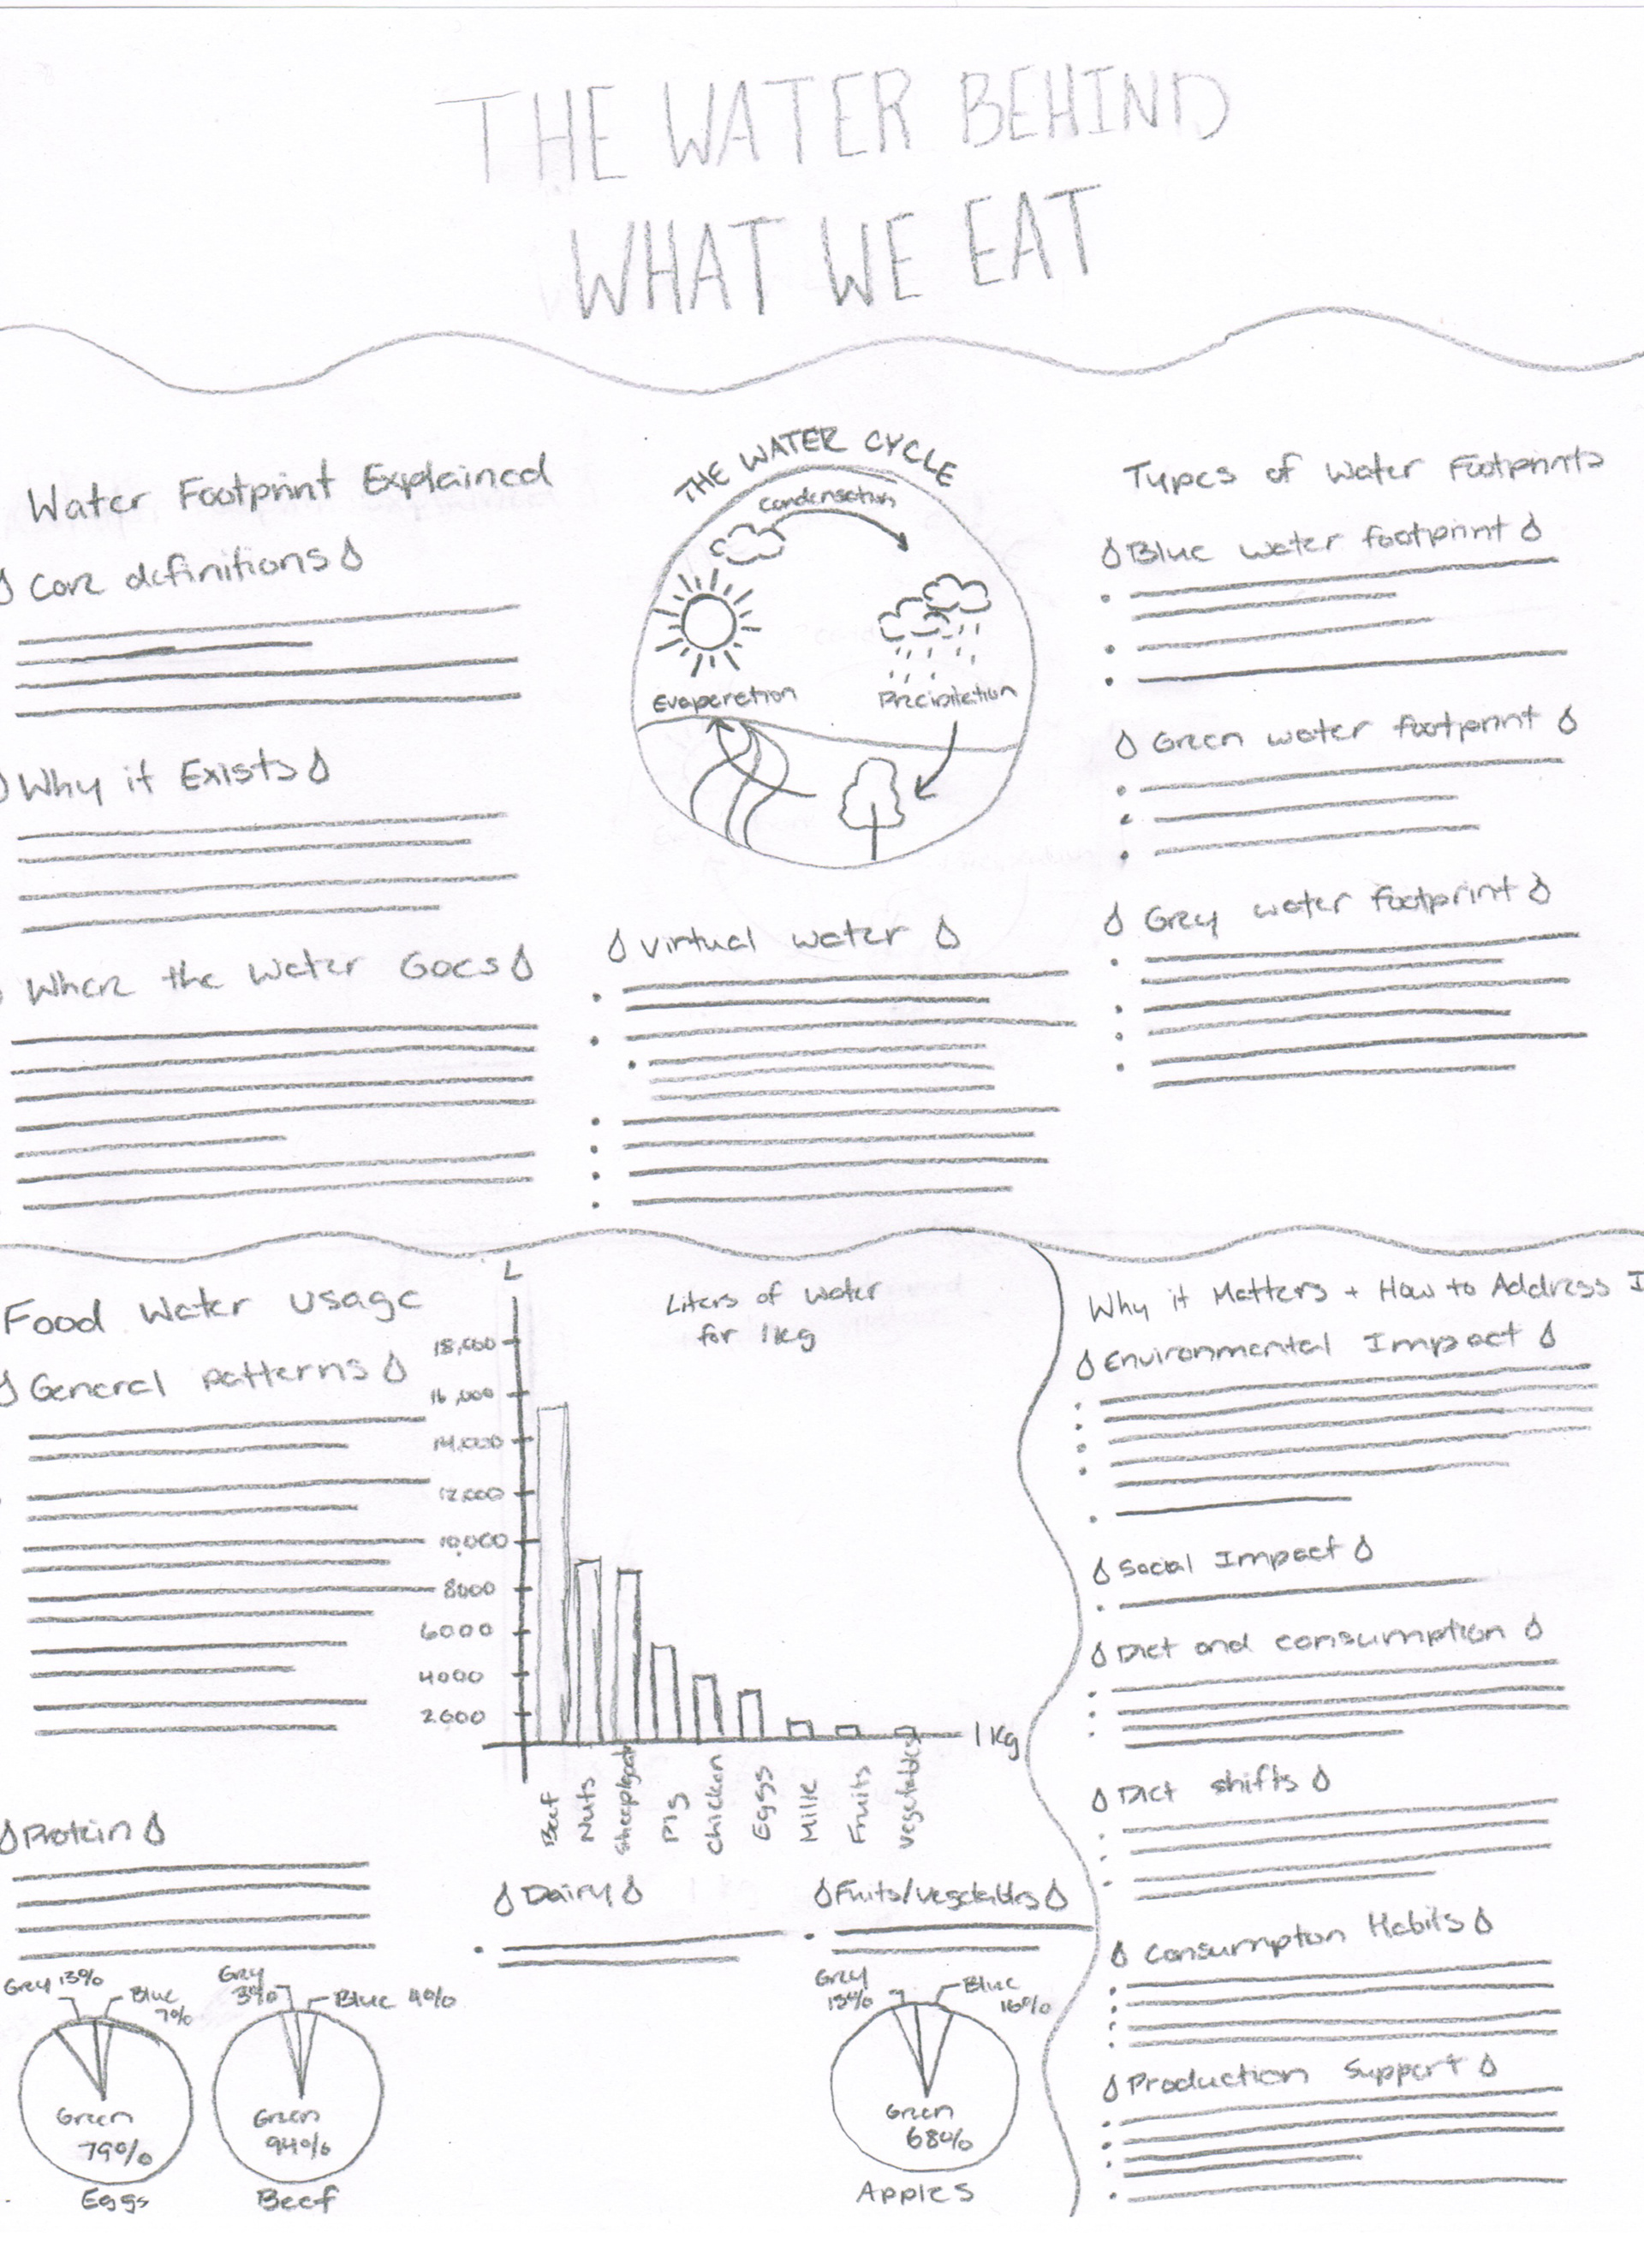
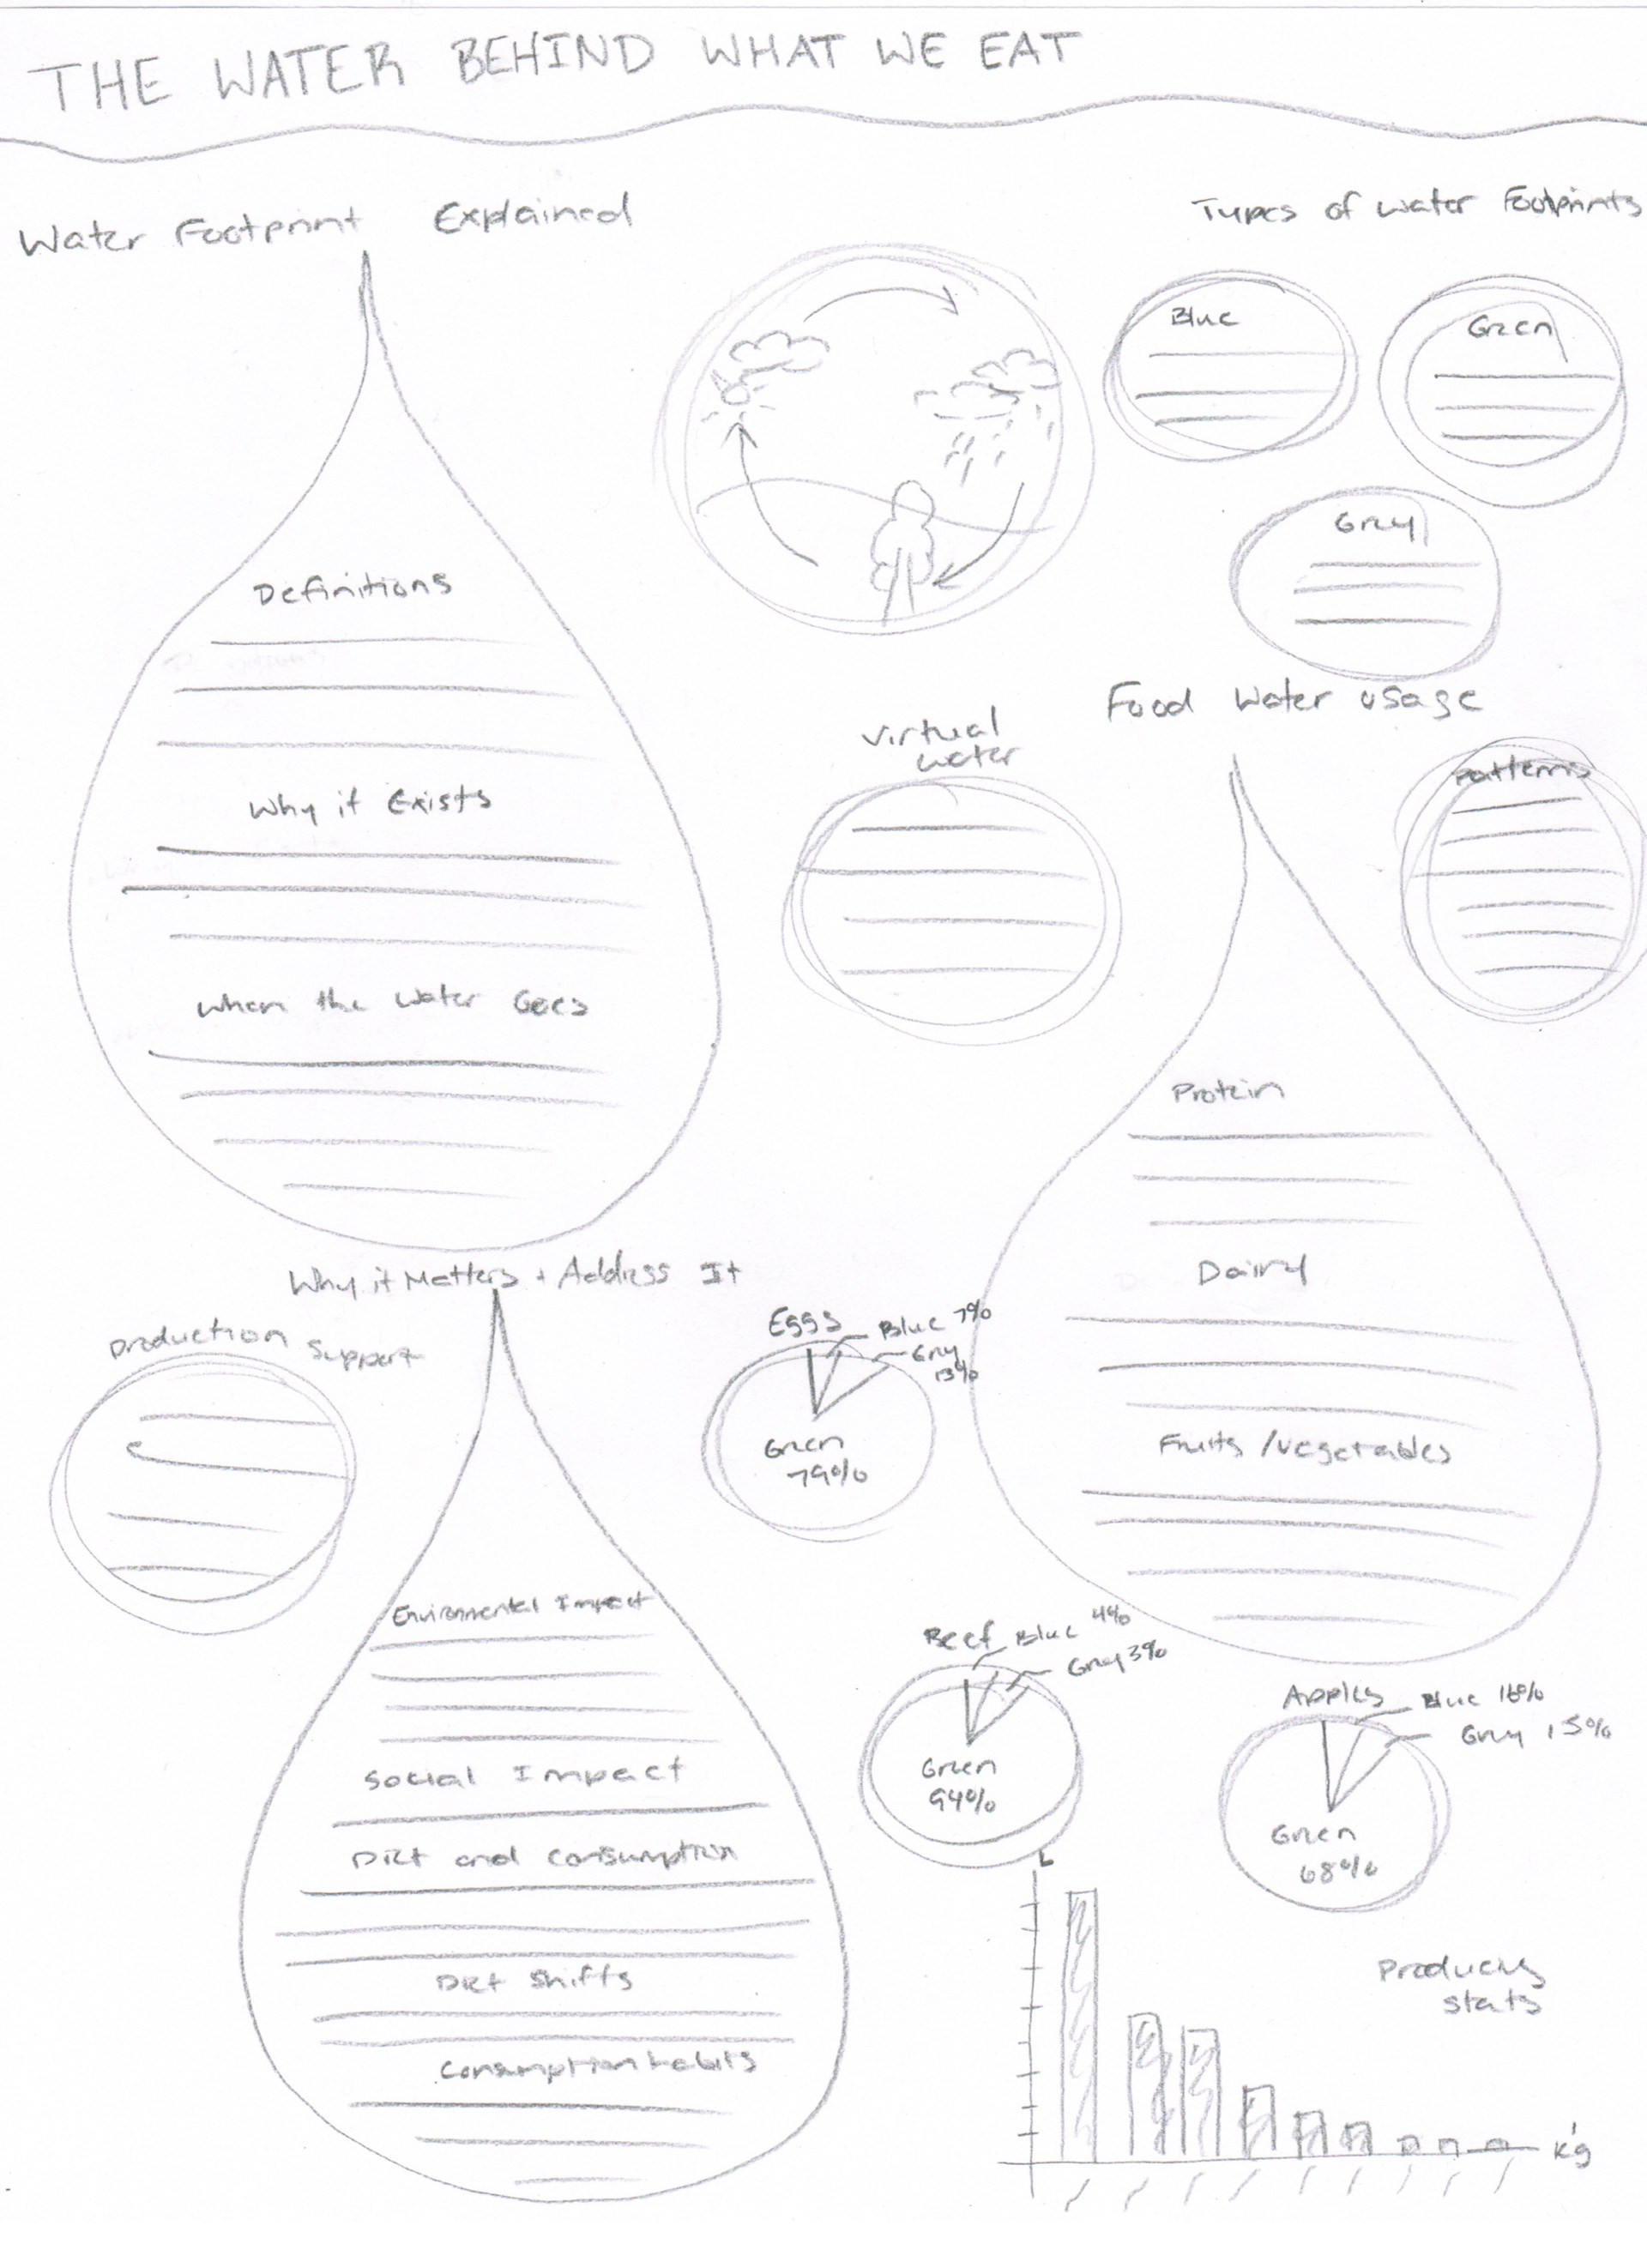
I began by sketching a variety of layouts and visual approaches for organizing the information. The process moved from macro to micro thinking, starting with the overall structure and flow of the infographic before refining the placement, hierarchy, and amount of information included within each section.



Digitalization
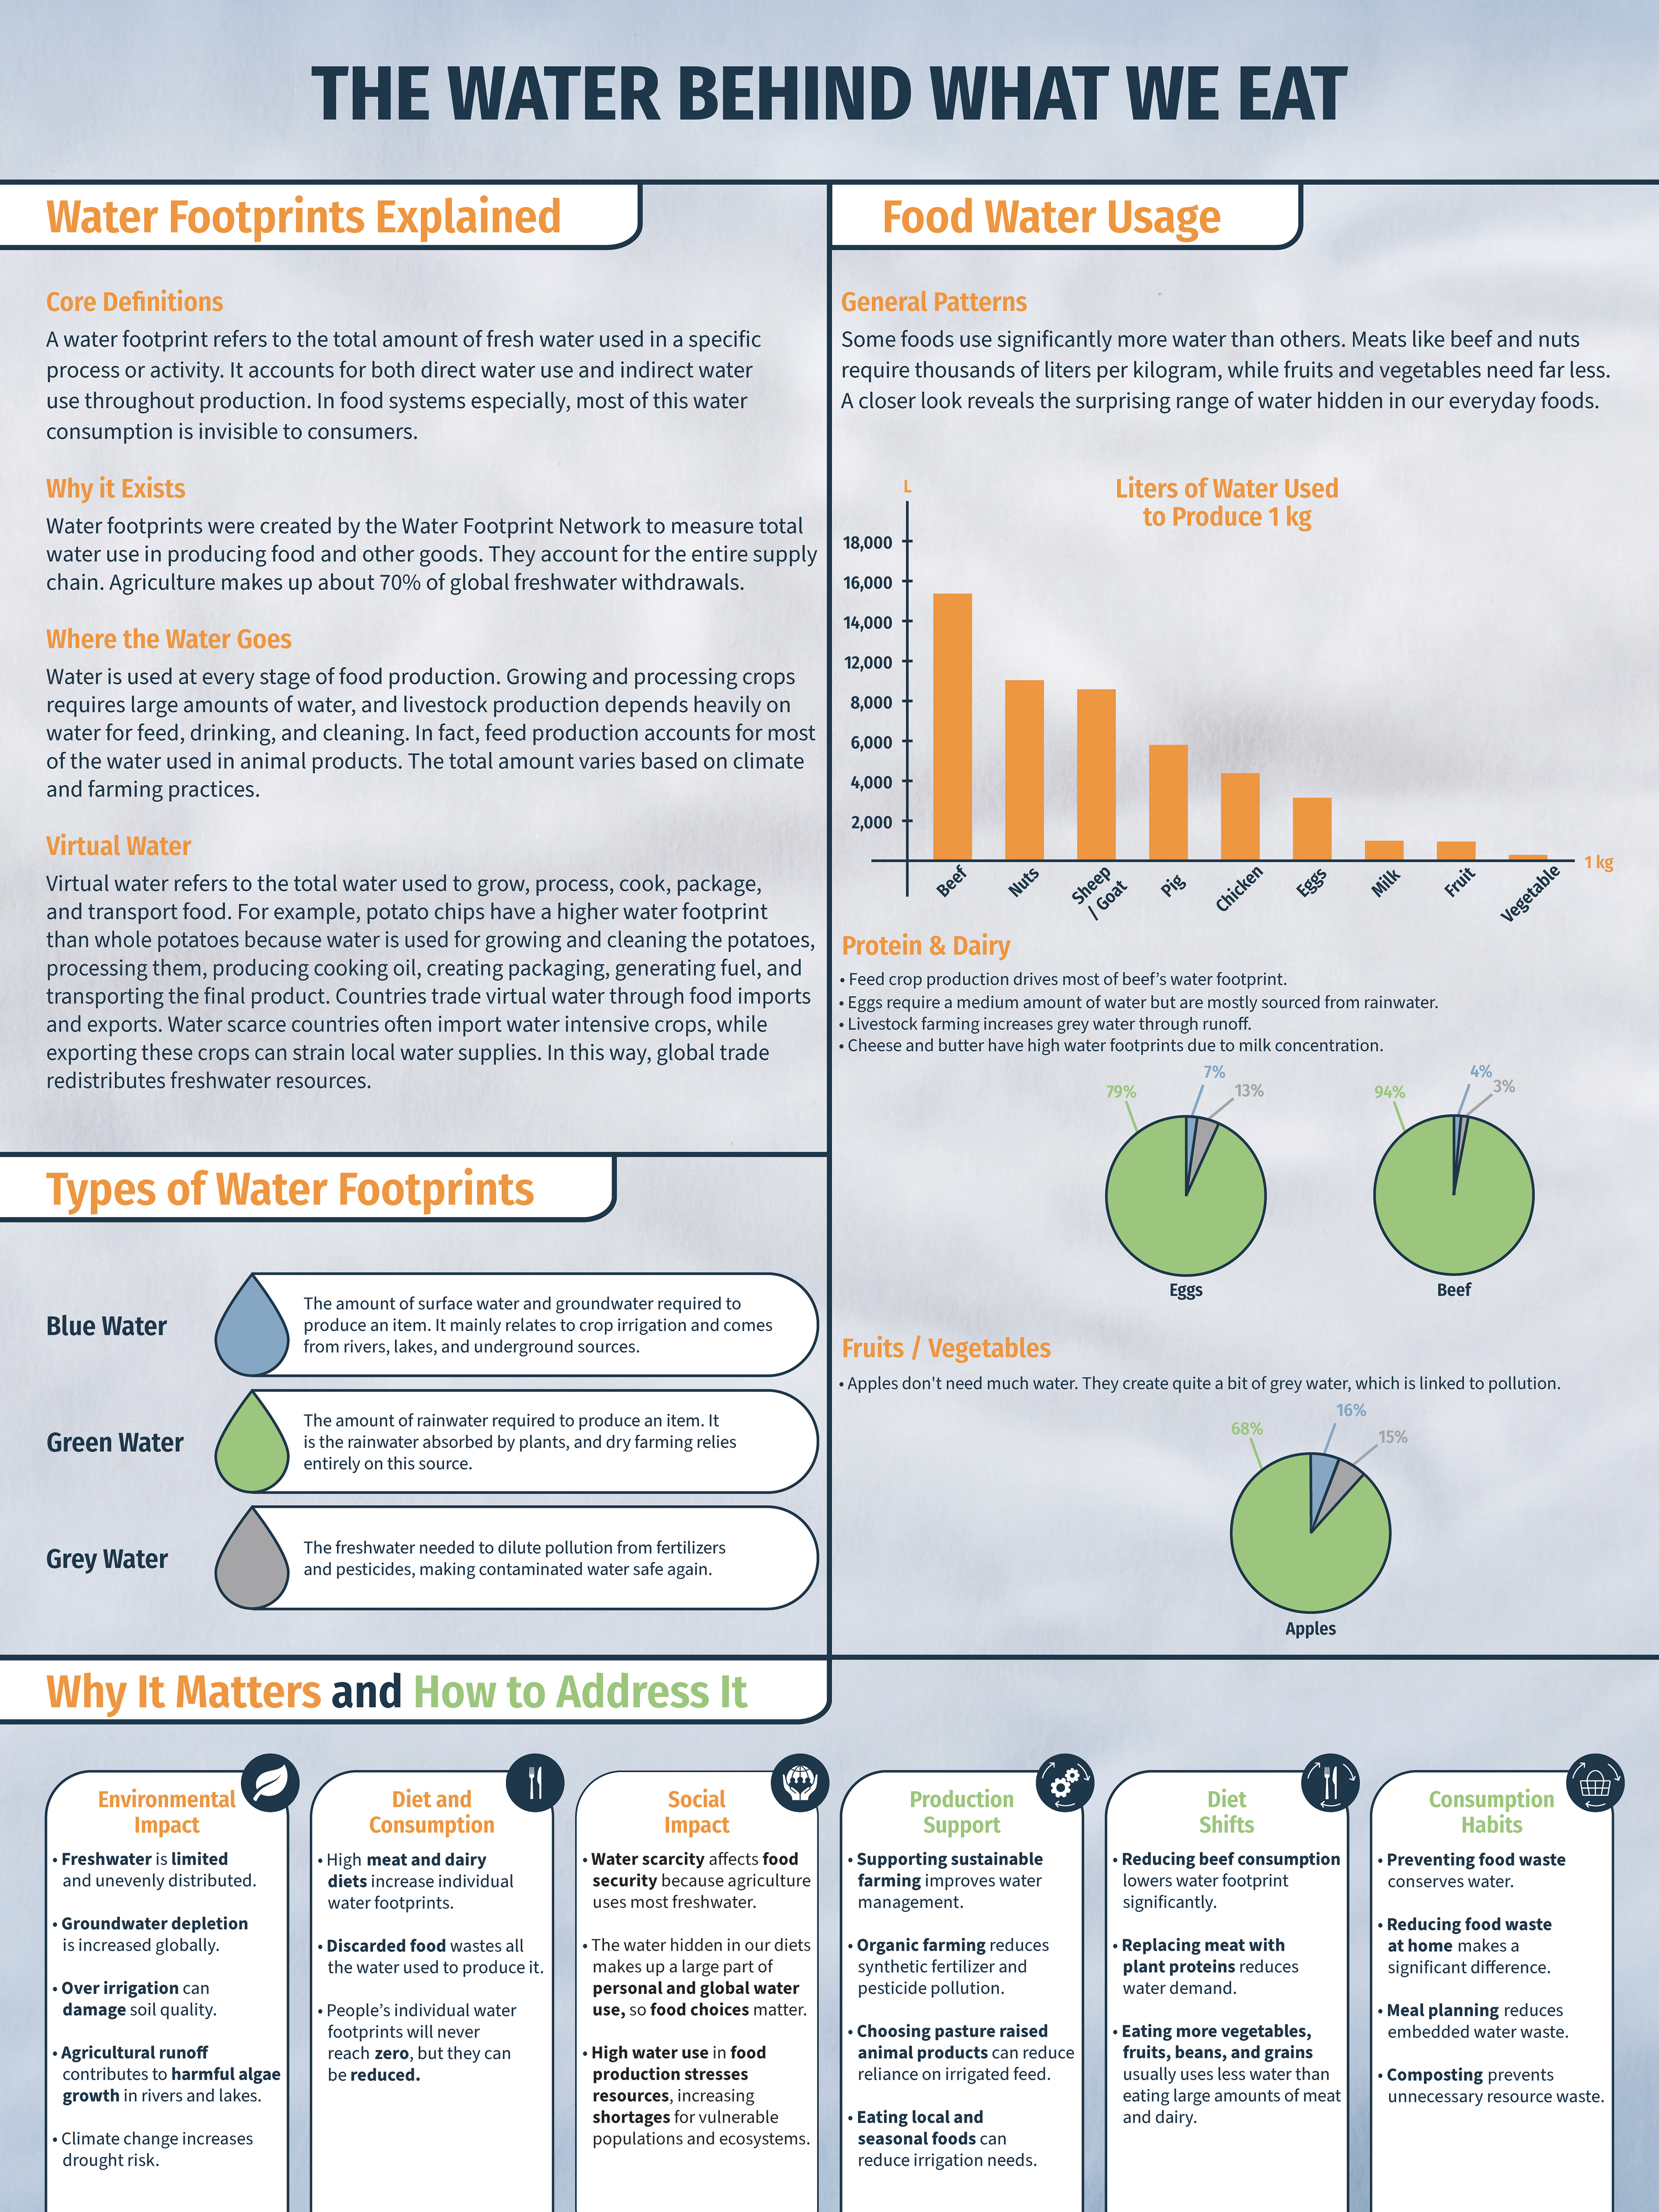
From the sketching phase, I selected one concept to develop digitally in Adobe Illustrator. The final direction was a combination of two initial sketches, refined through feedback from both my professor and peers. This iterative process helped strengthen the overall composition and clarify the structure before moving into the final design.




Color and Typography
I developed a cohesive and clear design system using a color palette of blues and greens, with an accent orange to highlight key information and create visual hierarchy throughout the infographic.

Final
